![]()

19 January 2021
Simon Schneider
simschne@uni-potsdam.de
Jonathan R. Weiss
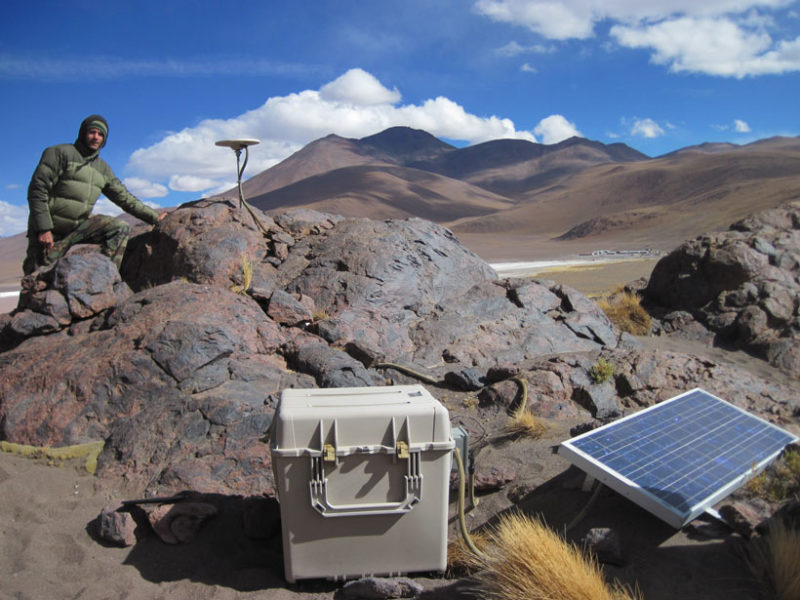
Jonathan Weiss checks the GPS ground motion sensor COLO [Henderson and Pritchard, 2017] on the Altiplano-Puna Plateau of the southern Bolivian Andes. This sensor is part of a dense GPS network spanning South America. A data logger and solar panel power source appear in the foreground. Credit: J. Weiss/University of Potsdam (DE).
Major earthquakes occur frequently in the subduction zone west of the Andes, the 7,500-kilometer-long mountain belt that runs along the Pacific coast of South America. These earthquakes have been documented since the early expeditions of Alexander von Humboldt and Charles Darwin. Despite all that has been learned through countless investigations across this region over the past few decades, earthquake science and space-based observations [Elliott et al., 2016]* can still tell us much more as we await the next “big one.” In particular, detailed knowledge of Earth’s structure and state of stress in seismically active regions is critical for understanding the controls on earthquake generation and for improving hazard assessment, preparation, and response. This knowledge can be obtained using a variety of field-based, instrumental, and experimental techniques.
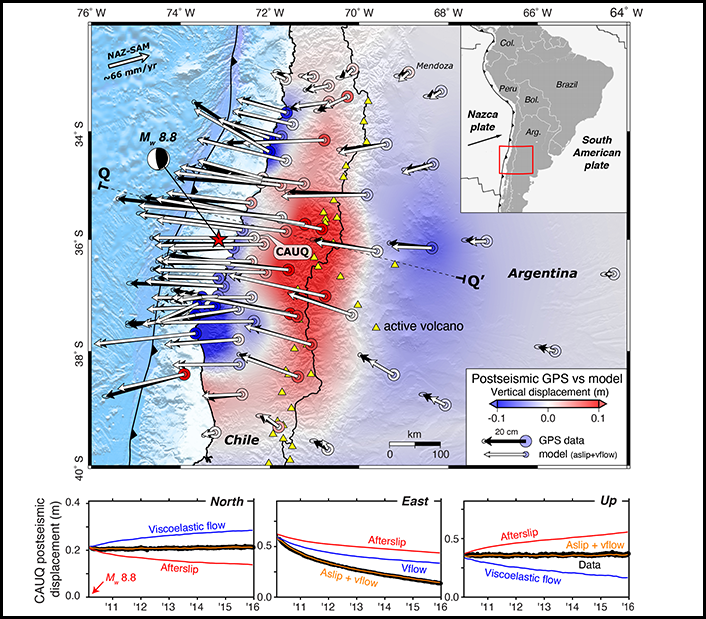
Fig. 1. This map (top) shows the location (red star) and focal mechanism (beach ball) of the 2010 Maule earthquake with 6 years of cumulative horizontal postseismic displacements (black vectors) and model results (white vectors) reflecting the combined contribution of afterslip on the megathrust fault and ductile flow in the lower crust and upper mantle. Cumulative vertical GPS and model displacements are shown as nested large and small colored circles, respectively. Background colors show interpolated model vertical motions overlain on regional hill-shaded topography. Time series plots (bottom) show north, east, and upward postseismic displacements for GPS site CAUQ located a few tens of kilometers east of the earthquake. Black circles are the observed daily positions. Red and blue curves are modeled afterslip and viscoelastic flow, respectively. When summed, these give the total model prediction in orange, which matches the observations. Note that for this GPS site, the combined afterslip and viscoelastic flow resulted in almost no northward or vertical motion, so the orange curves are nearly flat. Modified from Weiss et al. [2019], CC BY 4.0.
When the moment magnitude (Mw) 8.8 Maule earthquake [Vigny et al., 2011] struck off the coast of central Chile in early 2010, a dense regional network of continuously operating GPS stations was already in place (Figure 1). This was the largest earthquake to occur in the region in 50 years [Melnick et al., 2018], and the GPS network, which spans South America from the Chilean coastline in the west to the rain forests of Brazil in the east, recorded ground movements before, during, and after the event.
Our team used these GPS measurements, coupled with a newly developed numerical modeling technique, to investigate the structure and composition of deep rock in the region surrounding the 2010 earthquake, with the goal of improving our understanding of subduction zone processes, including earthquake generation.
Finding Signals in the Noise
One member of our team, Jonathan Weiss, has spent years investigating the process of mountain building, called orogenesis. Weiss uses the GPS instruments, which are similar to but much more sensitive than those in your cellular phone, to measure horizontal and vertical ground motions as small as a few millimeters per year. Studying the GPS data can reveal detailed information about the forces responsible for mountain building over million-year timescales, the short-term behavior of rock in response to earthquake-induced stress changes, and even seasonal cycles of rainfall in the Amazon basin.
In past work investigating the central Andes in southern Bolivia, where the seismic hazard may be drastically underestimated [Brooks et al., 2011], Weiss and colleagues used GPS time series measurements to quantify deformation rates during the time period between major subduction zone earthquakes in Peru and Chile (i.e., the interseismic phase of the subduction zone earthquake cycle) [Wang et al., 2012; Weiss et al., 2016].
In addition to the interseismic signal, these time series also contained signals associated with both coseismic deformation (rapid surface displacement that occurs during an earthquake) and postseismic deformation (characteristic transient surface motion that typically occurs after large events). Postseismic deformation can occur for months to years following large subduction zone earthquakes and is thought to reflect the combined effect of continued slip on the subduction zone interface after the main event (afterslip) and the flow of viscoelastic material in the lower crust and upper mantle (relaxation). At the time, Weiss viewed the coseismic and postseismic signals as unrelated to the slow accumulation of tectonic strain occurring between earthquakes and associated with mountain building, and he therefore put significant effort into characterizing and removing these so-called postseismic transients from the GPS data.
Subsequently, Weiss met Qiu Qiang, known familiarly as “QQ,” while both were working at the Centre for the Observation and Modelling of Earthquakes, Volcanoes and Tectonics (COMET) at the University of Leeds in the United Kingdom. The two began discussing mutual research interests, including how to interpret the postseismic transients, a topic QQ worked on extensively while analyzing earthquakes in Sumatra [Qiu et al., 2018]. At the suggestion of COMET director Tim Wright, they used GPS measurements from South America and applied a new numerical modeling method developed by Sylvain Barbot from the University of Southern California and expanded upon by QQ.
The method involves geophysical data inversion: Rather than starting with rock parameters like viscosity and layer thickness to build a simulation of the surface motion recorded in the GPS data (i.e., a forward model), the approach starts with the postseismic surface displacement time series measured at each GPS site. It then back-calculates (inverts for) the time-varying distribution of afterslip on the megathrust fault and the viscous stress and strain rate in the lithosphere-asthenosphere system (the brittle rock of Earth’s crust and the ductile mantle rock below) that produced the observed deformation (Figure 1). The stress-strain rate information, in turn, can be used to estimate changes in lower crustal and upper mantle viscosity thought to occur in response to large earthquakes. Thus, the approach can reveal information about rock mechanical properties using surface motion measurements alone while requiring significantly less computational time and resources than commonly used forward modeling methods.
Our team, which includes QQ, Barbot, Wright, and collaborators in the United States and South America, was excited to test the limits of this new method while probing Earth’s structure beneath a portion of the southern Andes. We analyzed postseismic GPS data from the Maule earthquake recorded by the South American GPS network. This network, installed and maintained by numerous government agencies, academic institutions, and international research groups, provides a detailed view of Maule-related surface deformation, particularly when compared with records of other recent giant (Mw ≥ 8.5) subduction earthquakes that occurred either far out at sea (e.g., Tohoku-Oki) or where coverage by geodetic networks was sparse (e.g., Sumatra) [Fujiwara et al., 2011; Qiu et al., 2018].
Maule’s Story
The Maule postseismic data show a complex displacement pattern associated with fault slip near the coast and viscous relaxation (flow) in the lower crust and upper mantle in the region surrounding the earthquake and extending eastward across the spine of the high Andes to the foreland basin of western Argentina [Weiss et al., 2019].
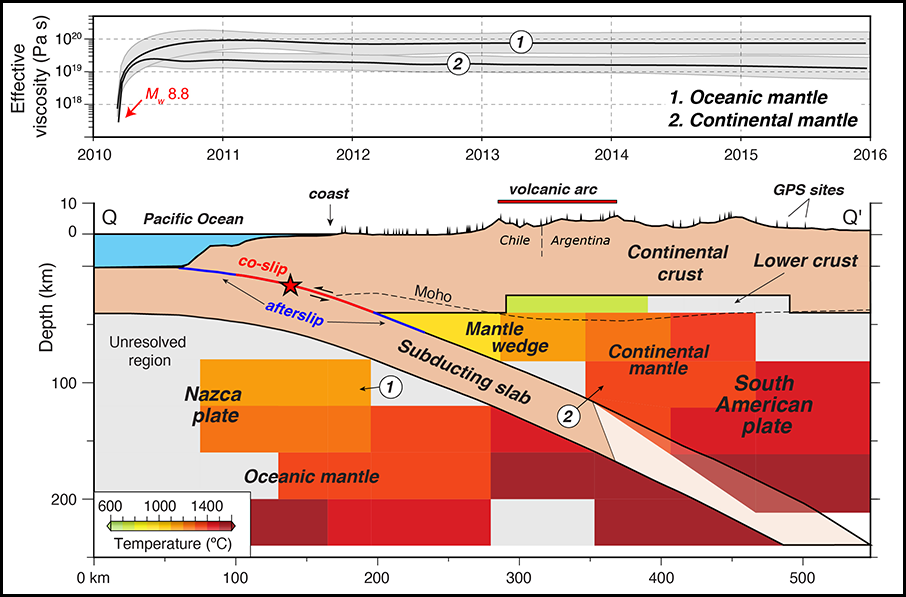
Fig. 2. The time evolution (top) of effective viscosity for portions of the oceanic mantle beneath the subducting slab (1) and of the continental mantle beneath the high Andes (2) illustrates the rapid increase in viscosity that occurred immediately after the Maule earthquake and the subsequent difference in long-term, steady state viscosity between the two locations. Subsurface temperature estimates (bottom) based on rock properties constrained by the inverted steady state stresses and strain rates assuming appropriate rheological properties and deformation mechanism (i.e., dislocation creep). Of particular note are the relatively cold (and wet) mantle wedge and lower crust, which play roles in seismogenesis and arc volcanism, respectively. Modified from Weiss et al. [2019], CC BY 4.0.
Using the new modeling approach, our team mapped the time-varying viscosity structure of the region, including a rapid, nearly 100-fold increase in viscosity that occurred during the first few weeks after the earthquake (Figure 2). Other newly identified features include a large viscosity contrast between the upper mantle portions of the subducting Nazca and overriding South American plates, a relatively strong (i.e., high-viscosity) mantle wedge corner near the intersection of these two plates, and a strong lower crust beneath the Andean volcanic arc.
We also tracked the time evolution of afterslip on the megathrust and found that most of this slip (up to 8 meters) occurred at shallow depths above and partially surrounding the main rupture zone. This pattern differs from previous studies that suggest primarily deep afterslip, but it is required to explain the nearshore vertical displacement pattern seen with GPS. Our analysis of the afterslip also indicated that friction along the megathrust fault in the vicinity of the Maule earthquake is highly variable and partially controlled by the local geology of the upper plate, which can result in shallow slip behavior that differs over short distances. This observation reveals the locations where coseismic slip is most likely to reach the seafloor and potentially cause a tsunami in the event of future large earthquakes in the same region.
We took this work one step further by exploiting well-known, experimentally determined flow laws [Bürgmann and Dresen, 2008] that relate stress and strain rate as rock deforms. In ductile regions, rock strength is controlled by several rheological parameters, and we were able to estimate two of these elusive but important controls on ductile flow at depth in the region surrounding the earthquake: temperature distribution and water content (Figure 2). These parameters exert strong controls on the size of the seismogenic zone and on arc volcanism and subduction zone dynamics. For example, the weak lower crust beneath the Andes is wet, indicating the presence of partial melt or fluids beneath the volcanic arc. Also, the strong, cold, and wet mantle wedge corner and the sharp thermal gradient between it and the adjacent hot and wet upper mantle help to maintain conditions that promote earthquake nucleation.
A New Piece of the Puzzle
Our study confirms that the combination of a dense network of GPS sites and the new inversion algorithm can significantly increase our knowledge of subduction zone structure, rheology, and the state of stress in seismically active regions. These factors ultimately control the distribution and frequency of large earthquakes and volcanic activity.
This work provides a new piece of the puzzle that may aid scientists in determining when and where destructive earthquakes will occur. We are currently extending our analysis along the Chilean coast to the north. We believe that the surface displacements associated with recent large subduction earthquakes recorded in the GPS data in this region will help reveal additional details of the geodynamics of the South American margin and further our understanding of subduction zones worldwide.
*All references below.
References
Brooks, B. A. et al. (2011), Orogenic-wedge deformation and potential for great earthquakes in the central Andean backarc, Nat. Geosci., 4(6), 380–383, https://doi.org/10.1038/ngeo1143.
Bürgmann, R., and G. Dresen (2008), Rheology of the lower crust and upper mantle: Evidence from rock mechanics, geodesy, and field observations, Annu. Rev. Earth Planet. Sci., 36(1), 531–567, https://doi.org/10.1146/annurev.earth.36.031207.124326.
Elliott, J. R., R. J. Walters, and T. J. Wright (2016), The role of space-based observation in understanding and responding to active tectonics and earthquakes, Nat. Commun., 7, 13844, https://doi.org/10.1038/ncomms13844.
Fujiwara, T., et al. (2011), The 2011 Tohoku-Oki earthquake: Displacement reaching the trench axis, Science, 334(6060), 1240, https://doi.org/10.1126/science.1211554.
Henderson, S. T., and M. E. Pritchard (2017), Time-dependent deformation of Uturuncu volcano, Bolivia, constrained by GPS and InSAR measurements and implications for source models, Geosphere, 13(6), 1,834–1,854, https://doi.org/10.1130/GES01203.1.
Melnick, D., et al. (2018), Back to full interseismic plate locking decades after the giant 1960 Chile earthquake, Nat. Commun., 9(1), 3527, https://doi.org/10.1038/s41467-018-05989-6.
Qiu, Q., et al. (2018), Transient rheology of the Sumatran mantle wedge revealed by a decade of great earthquakes, Nat. Commun., 9(1), 995, https://doi.org/10.1038/s41467-018-03298-6.
Vigny, C., et al. (2011), The 2010 Mw 8.8 Maule megathrust earthquake of central Chile, monitored by GPS, Science, 332(6036), 1,417–1,421, https://doi.org/10.1126/science.1204132.
Wang, K., Y. Hu, and J. He (2012), Deformation cycles of subduction earthquakes in a viscoelastic Earth, Nature, 484(7394), 327–332, https://doi.org/10.1038/nature11032.
Weiss, J. R., et al. (2016), Isolating active orogenic wedge deformation in the southern Subandes of Bolivia, J. Geophys. Res. Solid Earth, 121(8), 6,192–6,218, https://doi.org/10.1002/2016JB013145.
Weiss, J. R., et al. (2019), Illuminating subduction zone rheological properties in the wake of a giant earthquake, Sci. Adv., 5(12), eaax6720, https://doi.org/10.1126/sciadv.aax6720.
![]()
![]()
Earthquake Network projectEarthquake Network is a research project which aims at developing and maintaining a crowdsourced smartphone-based earthquake warning system at a global level. Smartphones made available by the population are used to detect the earthquake waves using the on-board accelerometers. When an earthquake is detected, an earthquake warning is issued in order to alert the population not yet reached by the damaging waves of the earthquake.
The project started on January 1, 2013 with the release of the homonymous Android application Earthquake Network. The author of the research project and developer of the smartphone application is Francesco Finazzi of the University of Bergamo, Italy.
Get the app in the Google Play store.
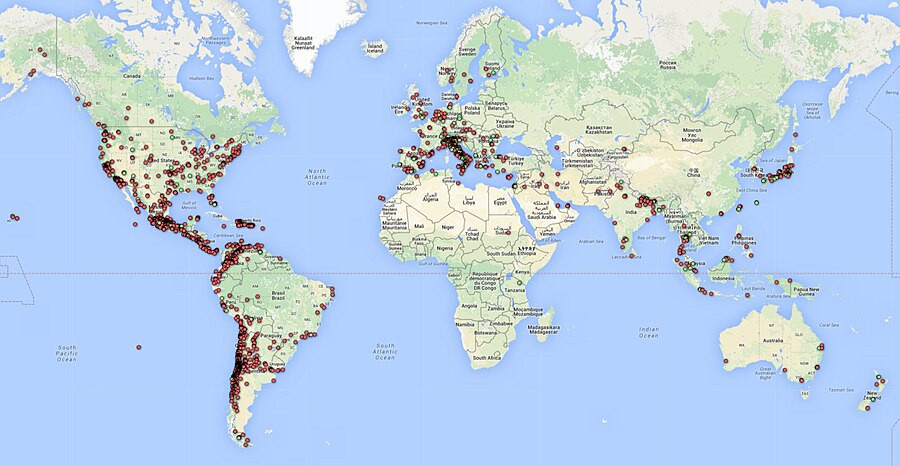
Smartphone network spatial distribution (green and red dots) on December 4, 2015
Meet The Quake-Catcher Network

The Quake-Catcher Network is a collaborative initiative for developing the world’s largest, low-cost strong-motion seismic network by utilizing sensors in and attached to internet-connected computers. With your help, the Quake-Catcher Network can provide better understanding of earthquakes, give early warning to schools, emergency response systems, and others. The Quake-Catcher Network also provides educational software designed to help teach about earthquakes and earthquake hazards.
After almost eight years at Stanford, and a year at CalTech, the QCN project is moving to the University of Southern California Dept. of Earth Sciences. QCN will be sponsored by the Incorporated Research Institutions for Seismology (IRIS) and the Southern California Earthquake Center (SCEC).
The Quake-Catcher Network is a distributed computing network that links volunteer hosted computers into a real-time motion sensing network. QCN is one of many scientific computing projects that runs on the world-renowned distributed computing platform Berkeley Open Infrastructure for Network Computing (BOINC).

The volunteer computers monitor vibrational sensors called MEMS accelerometers, and digitally transmit “triggers” to QCN’s servers whenever strong new motions are observed. QCN’s servers sift through these signals, and determine which ones represent earthquakes, and which ones represent cultural noise (like doors slamming, or trucks driving by).
There are two categories of sensors used by QCN: 1) internal mobile device sensors, and 2) external USB sensors.
Mobile Devices: MEMS sensors are often included in laptops, games, cell phones, and other electronic devices for hardware protection, navigation, and game control. When these devices are still and connected to QCN, QCN software monitors the internal accelerometer for strong new shaking. Unfortunately, these devices are rarely secured to the floor, so they may bounce around when a large earthquake occurs. While this is less than ideal for characterizing the regional ground shaking, many such sensors can still provide useful information about earthquake locations and magnitudes.
USB Sensors: MEMS sensors can be mounted to the floor and connected to a desktop computer via a USB cable. These sensors have several advantages over mobile device sensors. 1) By mounting them to the floor, they measure more reliable shaking than mobile devices. 2) These sensors typically have lower noise and better resolution of 3D motion. 3) Desktops are often left on and do not move. 4) The USB sensor is physically removed from the game, phone, or laptop, so human interaction with the device doesn’t reduce the sensors’ performance. 5) USB sensors can be aligned to North, so we know what direction the horizontal “X” and “Y” axes correspond to.
If you are a science teacher at a K-12 school, please apply for a free USB sensor and accompanying QCN software. QCN has been able to purchase sensors to donate to schools in need. If you are interested in donating to the program or requesting a sensor, click here.
BOINC is a leader in the field(s) of Distributed Computing, Grid Computing and Citizen Cyberscience.BOINC is more properly the Berkeley Open Infrastructure for Network Computing, developed at UC Berkeley.
Earthquake safety is a responsibility shared by billions worldwide. The Quake-Catcher Network (QCN) provides software so that individuals can join together to improve earthquake monitoring, earthquake awareness, and the science of earthquakes. The Quake-Catcher Network (QCN) links existing networked laptops and desktops in hopes to form the worlds largest strong-motion seismic network.
Below, the QCN Quake Catcher Network map

ShakeAlert: An Earthquake Early Warning System for the West Coast of the United States

The U. S. Geological Survey (USGS) along with a coalition of State and university partners is developing and testing an earthquake early warning (EEW) system called ShakeAlert for the west coast of the United States. Long term funding must be secured before the system can begin sending general public notifications, however, some limited pilot projects are active and more are being developed. The USGS has set the goal of beginning limited public notifications in 2018.
Watch a video describing how ShakeAlert works in English or Spanish.
The primary project partners include:
United States Geological Survey
California Governor’s Office of Emergency Services (CalOES)
California Geological Survey
California Institute of Technology
University of California Berkeley
University of Washington
University of Oregon
Gordon and Betty Moore Foundation
The Earthquake Threat
Earthquakes pose a national challenge because more than 143 million Americans live in areas of significant seismic risk across 39 states. Most of our Nation’s earthquake risk is concentrated on the West Coast of the United States. The Federal Emergency Management Agency (FEMA) has estimated the average annualized loss from earthquakes, nationwide, to be $5.3 billion, with 77 percent of that figure ($4.1 billion) coming from California, Washington, and Oregon, and 66 percent ($3.5 billion) from California alone. In the next 30 years, California has a 99.7 percent chance of a magnitude 6.7 or larger earthquake and the Pacific Northwest has a 10 percent chance of a magnitude 8 to 9 megathrust earthquake on the Cascadia subduction zone.
Part of the Solution
Today, the technology exists to detect earthquakes, so quickly, that an alert can reach some areas before strong shaking arrives. The purpose of the ShakeAlert system is to identify and characterize an earthquake a few seconds after it begins, calculate the likely intensity of ground shaking that will result, and deliver warnings to people and infrastructure in harm’s way. This can be done by detecting the first energy to radiate from an earthquake, the P-wave energy, which rarely causes damage. Using P-wave information, we first estimate the location and the magnitude of the earthquake. Then, the anticipated ground shaking across the region to be affected is estimated and a warning is provided to local populations. The method can provide warning before the S-wave arrives, bringing the strong shaking that usually causes most of the damage.
Studies of earthquake early warning methods in California have shown that the warning time would range from a few seconds to a few tens of seconds. ShakeAlert can give enough time to slow trains and taxiing planes, to prevent cars from entering bridges and tunnels, to move away from dangerous machines or chemicals in work environments and to take cover under a desk, or to automatically shut down and isolate industrial systems. Taking such actions before shaking starts can reduce damage and casualties during an earthquake. It can also prevent cascading failures in the aftermath of an event. For example, isolating utilities before shaking starts can reduce the number of fire initiations.
System Goal
The USGS will issue public warnings of potentially damaging earthquakes and provide warning parameter data to government agencies and private users on a region-by-region basis, as soon as the ShakeAlert system, its products, and its parametric data meet minimum quality and reliability standards in those geographic regions. The USGS has set the goal of beginning limited public notifications in 2018. Product availability will expand geographically via ANSS regional seismic networks, such that ShakeAlert products and warnings become available for all regions with dense seismic instrumentation.
Current Status
The West Coast ShakeAlert system is being developed by expanding and upgrading the infrastructure of regional seismic networks that are part of the Advanced National Seismic System (ANSS); the California Integrated Seismic Network (CISN) is made up of the Southern California Seismic Network, SCSN) and the Northern California Seismic System, NCSS and the Pacific Northwest Seismic Network (PNSN). This enables the USGS and ANSS to leverage their substantial investment in sensor networks, data telemetry systems, data processing centers, and software for earthquake monitoring activities residing in these network centers. The ShakeAlert system has been sending live alerts to “beta” users in California since January of 2012 and in the Pacific Northwest since February of 2015.
In February of 2016 the USGS, along with its partners, rolled-out the next-generation ShakeAlert early warning test system in California joined by Oregon and Washington in April 2017. This West Coast-wide “production prototype” has been designed for redundant, reliable operations. The system includes geographically distributed servers, and allows for automatic fail-over if connection is lost.
This next-generation system will not yet support public warnings but does allow selected early adopters to develop and deploy pilot implementations that take protective actions triggered by the ShakeAlert notifications in areas with sufficient sensor coverage.
Authorities
The USGS will develop and operate the ShakeAlert system, and issue public notifications under collaborative authorities with FEMA, as part of the National Earthquake Hazard Reduction Program, as enacted by the Earthquake Hazards Reduction Act of 1977, 42 U.S.C. §§ 7704 SEC. 2.
For More Information
Robert de Groot, ShakeAlert National Coordinator for Communication, Education, and Outreach
rdegroot@usgs.gov
626-583-7225
ShakeAlert Implementation Plan
See the full article here .

five-ways-keep-your-child-safe-school-shootings
Please help promote STEM in your local schools.
![]()
Eos is the leading source for trustworthy news and perspectives about the Earth and space sciences and their impact. Its namesake is Eos, the Greek goddess of the dawn, who represents the light shed on understanding our planet and its environment in space by the Earth and space sciences.
