![]()

31 August 2021
Simon A. Carn
scarn@mtu.edu
Paul A. Newman
Valentina Aquila
Helge Gonnermann
Josef Dufek
National Aeronautics Space Agency (US)’s rapid response plan for gathering atmospheric data amid major volcanic eruptions, paired with efforts to improve eruption simulations, will offer better views of these events’ global effects.
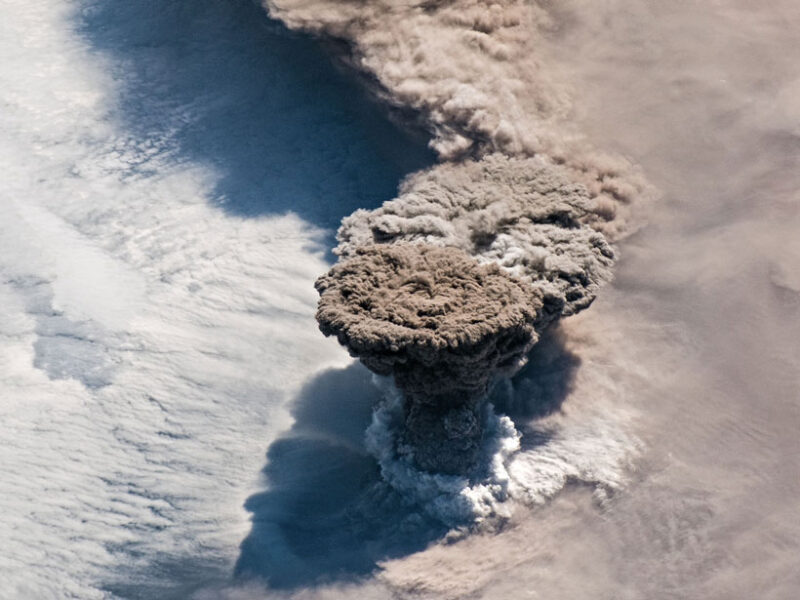
A thick cloud of volcanic ash and aerosols rises into the atmosphere above the north Pacific Ocean on 22 June 2019. An astronaut aboard the International Space Station captured this image of the plume during an eruption of Raikoke Volcano in the Kuril Islands. Credit: ISS Crew Earth Observations Facility and the Earth Science and Remote Sensing Unit, Johnson Space Center.
This year marks the 30th anniversary of the most recent volcanic eruption that had a measurable effect on global climate. In addition to devastating much of the surrounding landscape and driving thousands of people to flee the area, the June 1991 eruption at Mount Pinatubo in the Philippines sent towering plumes of gas, ash, and particulates high into the atmosphere—materials that ultimately reduced average global surface temperatures by up to about 0.5°C in 1991–1993. It has also been more than 40 years since the last major explosive eruption in the conterminous United States, at Mount St. Helens in Washington in May 1980. As the institutional memory of these infrequent, but high-impact, events fades in this country and new generations of scientists assume responsibility for volcanic eruption responses, the geophysical community must remain prepared for coming eruptions, regardless of these events’ locations.
Rapid responses to major volcanic eruptions enable scientists to make timely initial estimates of potential climate impacts (i.e., long-term effects) to assist responders in implementing mitigation efforts, including preparing for weather and climate effects in the few years following an eruption. These events also present critical opportunities to advance volcano science [National Academies of Sciences, Engineering, and Medicine (NASEM), 2017], and observations of large events with the potential to affect climate and life globally are particularly valuable.
Recognizing this value, NASA recently developed a volcanic eruption response plan to maximize the quantity and quality of observations it makes following eruptions [NASA, 2018*], and it is facilitating continuing research into the drivers and behaviors of volcanic eruptions to further improve scientific eruption response efforts.
*See References below
How Volcanic Eruptions Affect Climate
Major volcanic eruptions inject large amounts of gases; aerosols; and particulates into the atmosphere. Timely quantification of these emissions shortly after they erupt and as they disperse is needed to assess their potential climate effects. Scientists have a reasonable understanding of the fundamentals of how explosive volcanic eruptions influence climate and stratospheric ozone. This understanding is based on a few well-studied events in the satellite remote sensing era (e.g., Pinatubo) and on proxy records of older eruptions such as the 1815 eruption of Tambora in Indonesia [Robock, 2000]. However, the specific effects of eruptions depend on their magnitude, location, and the particular mix of materials ejected.
To affect global climate, an eruption must inject large quantities of sulfur dioxide (SO2) or other sulfur species (e.g., hydrogen sulfide, H2S) into the stratosphere, where they are converted to sulfuric acid (or sulfate) aerosols over weeks to months (Figure 1). The sulfate aerosols linger in the stratosphere for a few years, reflecting some incoming solar radiation and thus reducing global average surface temperatures by as much as about 0.5°C for 1–3 years, after which temperatures recover to preeruption levels.
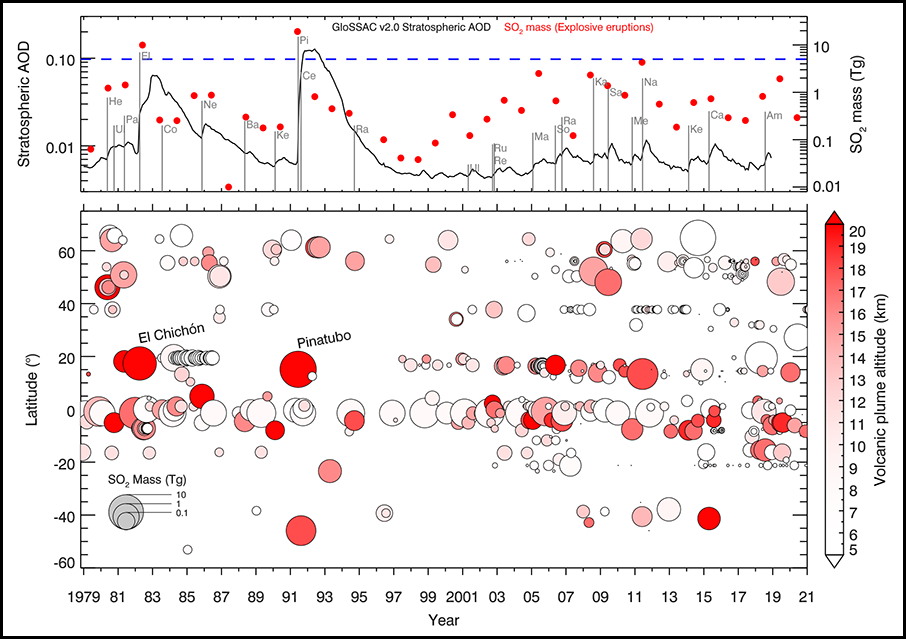
Fig. 1. In the top plot, the black curve represents monthly global mean stratospheric aerosol optical depth (AOD; background is 0.004 or below) for green light (525 nanometers) from 1979 to 2018 from the Global Space-based Stratospheric Aerosol Climatology (GloSSAC) [Kovilakam et al., 2020; Thomason et al., 2018]. AOD is a measure of aerosol abundance in the atmosphere. Red dots represent annual sulfur dioxide (SO2) emissions in teragrams (Tg) from explosive volcanic eruptions as determined from satellite measurements [Carn, 2021]. The dashed horizontal line indicates the 5-Tg SO2 emission threshold for a NASA eruption response. Vertical gray bars indicate notable volcanic eruptions and their SO2 emissions. From left to right, He = 1980 Mount St. Helens (United States), Ul = 1980 Ulawun (Papua New Guinea (PNG)), Pa = 1981 Pagan (Commonwealth of the Northern Mariana Islands), El = 1982 El Chichón (Mexico), Co = 1983 Colo (Indonesia), Ne = 1985 Nevado del Ruiz (Colombia), Ba = 1988 Banda Api (Indonesia), Ke = 1990 Kelut (Indonesia), Pi = 1991 Mount Pinatubo (Philippines), Ce = 1991 Cerro Hudson (Chile), Ra = 1994 Rabaul (PNG), Ru = 2001 Ulawun, 2002 Ruang (Indonesia), Re = 2002 Reventador (Ecuador), Ma = 2005 Manam (PNG), So = 2006 Soufriere Hills (Montserrat), Ra = 2006 Rabaul (PNG), Ka = 2008 Kasatochi (USA), Sa = 2009 Sarychev Peak (Russia), Me = 2010 Merapi (Indonesia), Na = 2011 Nabro (Eritrea), Ke = 2014 Kelut (Indonesia), Ca = 2015 Calbuco (Chile), Am = 2018 Ambae (Vanuatu). In the bottom plot, circles indicate satellite-measured SO2 emissions (symbol size denotes SO2 mass) and estimated plume altitudes (symbol color denotes altitude) for volcanic eruptions since October 1978 [Carn, 2021].
Although this direct radiative effect cools the surface, the aerosol particles also promote warming in the stratosphere by absorbing outgoing longwave radiation emitted from Earth’s surface as well as some solar radiation, which affects atmospheric temperature gradients and thus circulation (an indirect advective effect). This absorption of longwave radiation also promotes chemical reactions on the aerosol particles that drive stratospheric ozone depletion [Kremser et al., 2016], which reduces absorption of ultraviolet (UV) radiation and further influences atmospheric circulation. The interplay of aerosol radiative and advective effects, which both influence surface temperatures, leads to regional and seasonal variations in surface cooling and warming. For example, because advective effects tend to dominate in winter in the northern midlatitudes, winter warming of Northern Hemisphere continents—lasting about 2 years—is expected after major tropical eruptions [Shindell et al., 2004].
Eruptions from tropical volcanoes like Pinatubo typically generate more extensive stratospheric aerosol veils because material injected into the tropical stratosphere can spread into both hemispheres. However, major high-latitude eruptions can also have significant climate impacts depending on their season and the altitude that their eruption plumes reach [Toohey et al., 2019].
The effects of volcanic ash particles are usually neglected in climate models because the particles have shorter atmospheric lifetimes than sulfate aerosols, although recent work has suggested that persistent fine ash may influence stratospheric sulfur chemistry [Zhu et al., 2020]. This finding provides further motivation for timely sampling of volcanic eruption clouds.
The threshold amount of volcanic SO2 emissions required to produce measurable climate impacts is not known exactly. On the basis of prior eruptions, NASA considers that an injection of roughly 5 teragrams (5 million metric tons) of SO2 or more into the stratosphere has sufficient potential for climate forcing of –1 Watt per square meter (that is, 1 Watt per square meter less energy is put into Earth’s climate system as a result of the stratospheric aerosols produced from the SO2) and warrants application of substantial observational assets.
Since the dawn of the satellite era for eruption observations in 1978, this threshold has been surpassed by only two eruptions: at El Chichón (Mexico) in 1982 and Pinatubo in 1991 (Figure 1), which reached 5 and 6, respectively, on the volcanic explosivity index (VEI; a logarithmic scale of eruption size from 0 to 8). Since Pinatubo, the observational tools that NASA employs have greatly improved.
In the event of future eruptions on par with or larger than those at El Chichón and Pinatubo, rapid mobilization of NASA’s observational and research assets, including satellites, balloons, ground-based instruments, aircraft, and modeling capabilities, will permit scientists to make early initial estimates of potential impacts. Capturing the transient effects of volcanic aerosols on climate would also provide critical data to inform proposed solar geoengineering strategies that involve introducing aerosols into the atmosphere to mitigate global warming [NASEM, 2021].
NASA’s Eruption Response Plan
In the United States, NASA has traditionally led investigations of eruptions involving stratospheric injection because of the agency’s global satellite-based observation capabilities for measuring atmospheric composition and chemistry and its unique suborbital assets for measuring the evolution of volcanic clouds in the stratosphere.
Under its current plan, NASA’s eruption response procedures will be triggered in the event an eruption emits at least 5 teragrams of SO2 into the stratosphere, as estimated using NASA’s or other satellite assets [e.g., Carn et al., 2016]. The first phase of the response plan involves a review of near-real-time satellite data by a combined panel of NASA Headquarters (HQ) science program managers and NASA research scientists in parallel with initial modeling of the eruption plume’s potential atmospheric evolution and impacts.
The HQ review identifies relevant measurement and modeling capabilities at the various NASA centers and among existing NASA-funded activities. HQ personnel would establish and task science leads and teams comprising relevant experts from inside and outside NASA to take responsibility for observations from the ground, from balloons, and from aircraft. The efforts of these three groups would be supplemented by satellite observations and modeling to develop key questions, priority observations, and sampling and deployment plans.
Implementing the plan developed in this phase would likely result in major diversions and re-tasking of assets, such as NASA aircraft involved in meteorological monitoring, from ongoing NASA research activities and field deployments. Ensuring that these diversions are warranted necessitates that this review process is thorough and tasking assignments are carefully considered.
The second phase of NASA’s volcanic response plan—starting between 1 week and 1 month after the eruption—involves the application of its satellite platforms, ground observations from operational networks, and eruption cloud modeling. Satellites would track volcanic clouds to observe levels of SO2 and other aerosols and materials. Gathering early information on volcanic aerosol properties like density, particle composition, and particle size distribution would provide key information for assessing in greater detail the potential evolution and effects of the volcanic aerosols. Such assessments could provide valuable information on the amount of expected surface cooling attributable to these aerosols, as well as the lifetime of stratospheric aerosol particles—two factors that depend strongly on the aerosols’ size distribution and temporal evolution.
Meanwhile NASA’s Aerosol Robotic Network (AERONET); Micro-Pulse Lidar Network (MPLNET); and Southern Hemisphere Additional Ozonesondes (SHADOZ) would provide real-time observations from the ground. Eruption cloud modeling would be used to calculate cloud trajectories and dispersion to optimize selection of ground stations for balloon launches and re-tasking of airborne assets.
The third phase of the response plan—starting 1–3 months after an eruption—would see the deployment of rapid response balloons and aircraft (e.g., from NASA’s Airborne Science Program). The NASA P-3 Orion, Gulfstream V, and DC-8 aircraft have ranges of more than 7,000 kilometers and can carry heavy instrumentation payloads of more than 2,500 kilograms to sample the middle to upper troposphere. A mix of in situ and remote sensing instruments would be employed to collect detailed observations of eruption plume structure, evolution, and optical properties.
NASA’s high-altitude aircraft (ER-2 and WB-57f) provide coverage into the stratosphere (above about 18 kilometers) with payloads of more than 2,200 kilograms. These high-altitude planes would carry payloads for measuring the evolving aerosol distributions along with trace gas measurements in situ to further understand the response of stratospheric ozone and climate forcing to the eruption. In particular, the high-altitude observations would include data on the particle composition and size distribution of aerosols, as well as on ozone, SO2, nitrous oxide and other stratospheric tracers, water vapor, and free radical species. Instrumented balloons capable of reaching the stratosphere could also be rapidly deployed to remote locations to supplement these data in areas not reached by the aircraft.
The third phase would be staged as several 2- to 6-week deployments over a 1- to 2-year period that would document the seasonal evolution, latitudinal dispersion, and multiyear dissipation of the plume from the stratosphere. These longer-term observations would help to constrain model simulations of the eruption’s impacts on the global atmosphere and climate.
Enhancing Eruption Response
An effective eruption response is contingent on timely recognition of the hallmarks of a major volcanic eruption, namely, stratospheric injection and substantial emissions of SO2 (and H2S) amounting to more than 5 teragrams, using satellite data. However, it may take several hours to a day after an event for satellites to confirm that emissions have reached this level. By then, time has been lost to position instruments and personnel to effectively sample the earliest stages of an eruption, and it is already too late to observe the onset of the eruption.
Hence, a key element in efforts to strengthen eruption responses is improving our recognition of distinctive geophysical or geochemical eruption precursors that may herald a high-magnitude event. Observations of large, sulfur-rich eruptions such as Pinatubo have led to scientific consensus that such eruptions emit “excess” volatiles—gas emissions (especially sulfur species, but also other gases such as water vapor and carbon dioxide) exceeding those that could be derived from the erupted magma alone. Excess volatiles, in the form of gas bubbles derived from within or below a magma reservoir that then accumulate near the top of the reservoir, may exacerbate climate impacts of eruptions and influence magmatic processes like magma differentiation, eruption triggering and magnitude, and hydrothermal ore deposition [e.g., Edmonds and Woods, 2018]. They may also produce detectable eruption precursors and influence eruption and plume dynamics, although how remains largely unknown.
With support from NASA’s Interdisciplinary Research in Earth Science program, we (the authors) have begun an integrated investigation of eruption dynamics focused on understanding the fate of excess volatiles from their origins in a magma reservoir, through underground conduits and into a volcanic plume, and, subsequently, as they are dispersed in the atmosphere. The satellite observations we use are the same or similar to those required for rapid assessment and response to future high-magnitude events (with a VEI of 6 or greater).
Our investigation is using data from previous moderate-scale eruptions (VEI of 3–5) with excellent satellite observational records that captured instances in which gases and aerosols displayed disparate atmospheric dispersion patterns. Among the main questions we are examining is whether excess volatile accumulation in magma reservoirs can drive large eruptions and produce enhanced aerosol-related climate impacts resulting from these eruptions. Using numerical model simulations of eruptions involving variable quantities of excess volatiles, we will endeavor to reproduce the specific atmospheric distributions of gases and aerosols observed by satellites after these events and thus elucidate how volatile accumulation might influence plume dispersion and climate impacts.
We are currently developing a framework to simulate a future eruption with a VEI of 6+. Over the coming year, we hope to produce benchmark simulations that track the fate of volcanic gases as they travel from a subsurface magmatic system into the atmosphere to be distributed globally. This simulation framework will comprise a coupled suite of subsystem-scale numerical models, including models of magma withdrawal from the magma reservoir, magma ascent within the volcanic conduit, stratospheric injection within the volcanic plume, and atmospheric dispersion and effects on climate.
With these tools, NASA will have gained important capabilities in simulating volcanic eruptions and understanding their potential precursors. These capabilities will complement NASA’s satellite and suborbital observations of volcanic eruptions as they unfold—an important advance for volcano science and a powerful means to assess the climate impacts of future large explosive eruptions.
References:
Carn, S. A. (2021), Multi-Satellite Volcanic Sulfur Dioxide L4 Long-Term Global Database V4, USA, Goddard Earth Sci. Data and Inf. Serv. Cent., Greenbelt, Md., https://doi.org/10.5067/MEASURES/SO2/DATA405.
Carn, S. A., L. Clarisse, and A. J. Prata (2016), Multi-decadal satellite measurements of global volcanic degassing, J. Volcanol. Geotherm. Res., 311, 99–134, https://doi.org/10.1016/j.jvolgeores.2016.01.002.
Edmonds, M., and A. W. Woods (2018), Exsolved volatiles in magma reservoirs, J. Volcanol. Geotherm. Res., 368, 13–30, https://doi.org/10.1016/j.jvolgeores.2018.10.018.
Kovilakam, M., et al. (2020), The Global Space-based Stratospheric Aerosol Climatology (version 2.0): 1979–2018, Earth Syst. Sci. Data, 12(4), 2,607–2,634, https://doi.org/10.5194/essd-12-2607-2020.
Kremser, S., et al. (2016), Stratospheric aerosol—Observations, processes, and impact on climate, Rev. Geophys., 54(2), 278–335, https://doi.org/10.1002/2015RG000511.
NASA (2018), NASA Major Volcanic Eruption Response Plan, version 11, Greenbelt, Md., acd-ext.gsfc.nasa.gov/Documents/NASA_reports/Docs/VolcanoWorkshopReport_v12.pdf.
National Academies of Sciences, Engineering, and Medicine (NASEM) (2017), Volcanic Eruptions and Their Repose, Unrest, Precursors, and Timing, Natl. Acad. Press, Washington, D.C., https://doi.org/10.17226/24650.
National Academies of Sciences, Engineering, and Medicine (NASEM) (2021), Reflecting Sunlight: Recommendations for Solar Geoengineering Research and Research Governance, Natl. Acad. Press, Washington, D.C., https://doi.org/10.17226/25762.
Robock, A. (2000), Volcanic eruptions and climate, Rev. Geophys., 38(2), 191–219, https://doi.org/10.1029/1998RG000054.
Shindell, D. T., et al. (2004), Dynamic winter climate response to large tropical volcanic eruptions since 1600, J. Geophys Res., 109, D05104, https://doi.org/10.1029/2003JD004151.
Thomason, L. W., et al. (2018), A global space-based stratospheric aerosol climatology: 1979–2016, Earth Syst. Sci. Data, 10(1), 469–492, https://doi.org/10.5194/essd-10-469-2018.
Toohey, M., et al. (2019), Disproportionately strong climate forcing from extratropical explosive volcanic eruptions, Nat. Geosci., 12(2), 100–107, https://doi.org/10.1038/s41561-018-0286-2.
Zhu, Y., et al. (2020), Persisting volcanic ash particles impact stratospheric SO2 lifetime and aerosol optical properties, Nat. Commun., 11, 4526, https://doi.org/10.1038/s41467-020-18352-5.
See the full article here .

five-ways-keep-your-child-safe-school-shootings
Please help promote STEM in your local schools.
![]()
Eos is the leading source for trustworthy news and perspectives about the Earth and space sciences and their impact. Its namesake is Eos, the Greek goddess of the dawn, who represents the light shed on understanding our planet and its environment in space by the Earth and space sciences.
