![]()

8 July 2021
David Thompson
Philip G. Brodrick
Machine learning and signal processing methods offer significant benefits to the geosciences, but realizing this potential will require closer engagement among different research communities.
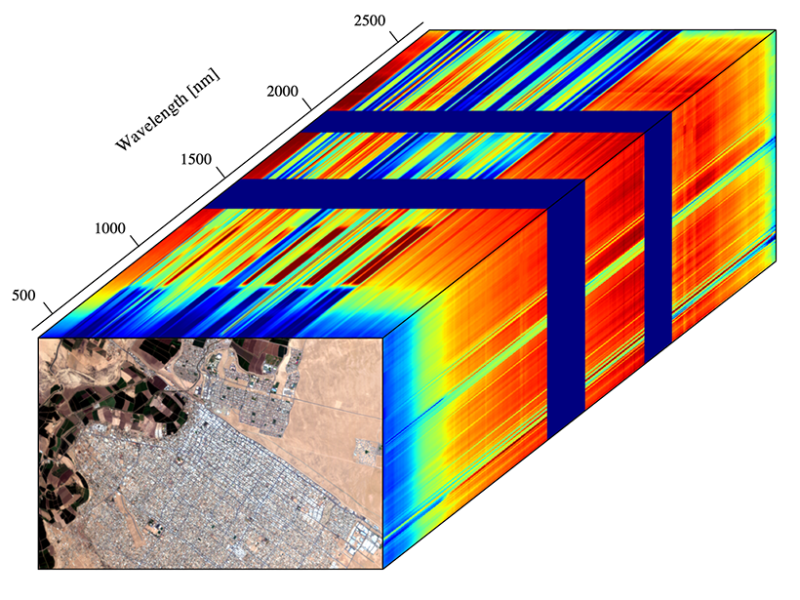
Remote imaging spectrometers acquire a cube of data with two spatial dimensions and one spectral dimension. These rich data products are used in a wide range of geoscience applications. Their high dimensionality and volumes seem well suited to data-driven analysis with machine learning tools, but after a decade of research, machine learning’s influence on imaging spectroscopy geoscience has been limited.
In recent years machine learning and pattern recognition methods have become common in Earth and space sciences. This is especially true for remote sensing applications, which often rely on massive archives of noisy data and so are well suited to such artificial intelligence (AI) techniques.
As the data science revolution matures, we can assess its impact on specific research disciplines. We focus here on imaging spectroscopy, also known as hyperspectral imaging, as a data-centric remote sensing discipline expected to benefit from machine learning. Imaging spectroscopy involves collecting spectral data from airborne and satellite sensors at hundreds of electromagnetic wavelengths for each pixel in the sensors’ viewing area.
Since the introduction of imaging spectrometers in the early 1980s, their numbers and sophistication have grown dramatically, and their application has expanded across diverse topics in Earth, space, and laboratory sciences. They have, for example, surveyed greenhouse gas emitters across California [Duren et al., 2019 (All cited references are below with links)], found water on the moon [Pieters et al., 2009], and mapped the tree chemistry of the Peruvian Amazon [Asner et al., 2017]. The data sets involved are large and complex. And a new generation of orbital instruments, slated for launch in coming years, will provide global coverage with far larger archives. Missions featuring these instruments include NASA’s Earth Surface Mineral Dust Source Investigation (EMIT) [Green et al., 2020] and Surface Biology and Geology investigation [National Academies of Sciences, Engineering, and Medicine, 2019].
Researchers have introduced modern signal processing and machine learning concepts to imaging spectroscopy analysis, with potential benefits for numerous areas of geoscience research. But to what extent has this potential been realized? To help answer this question, we assessed whether the growth in signal processing and pattern recognition research, indicated by an increasing number of peer-reviewed technical articles, has produced a commensurate impact on science investigations using imaging spectroscopy.
Mining for Data
Following an established method, we surveyed all articles cataloged in the Web of Science [Harzing and Alakangas, 2016] since 1976 with titles or abstracts containing the term “imaging spectroscopy” or “hyperspectral.” Then, using a modular clustering approach [Waltman et al., 2010], we identified clustered bibliographic communities among the 13,850 connected articles within the citation network.
We found that these articles fall into several independent and self-citing groups (Figure 1): optics and medicine, food and agriculture, machine learning, signal processing, terrestrial Earth science, aquatic Earth science, astrophysics, heliophysics, and planetary science. The articles in two of these nine groups (signal processing and machine learning) make up a distinct cluster of methodological research investigating how signal processing and machine learning can be used with imaging spectroscopy, and those in the other seven involve research using imaging spectroscopy to address questions in applied sciences. The volume of research has increased recently in all of these groups, especially those in the methods cluster (Figure 2). Nevertheless, these methods articles have seldom been cited by the applied sciences papers, drawing more than 96% of their citations internally but no more than 2% from any applied science group.
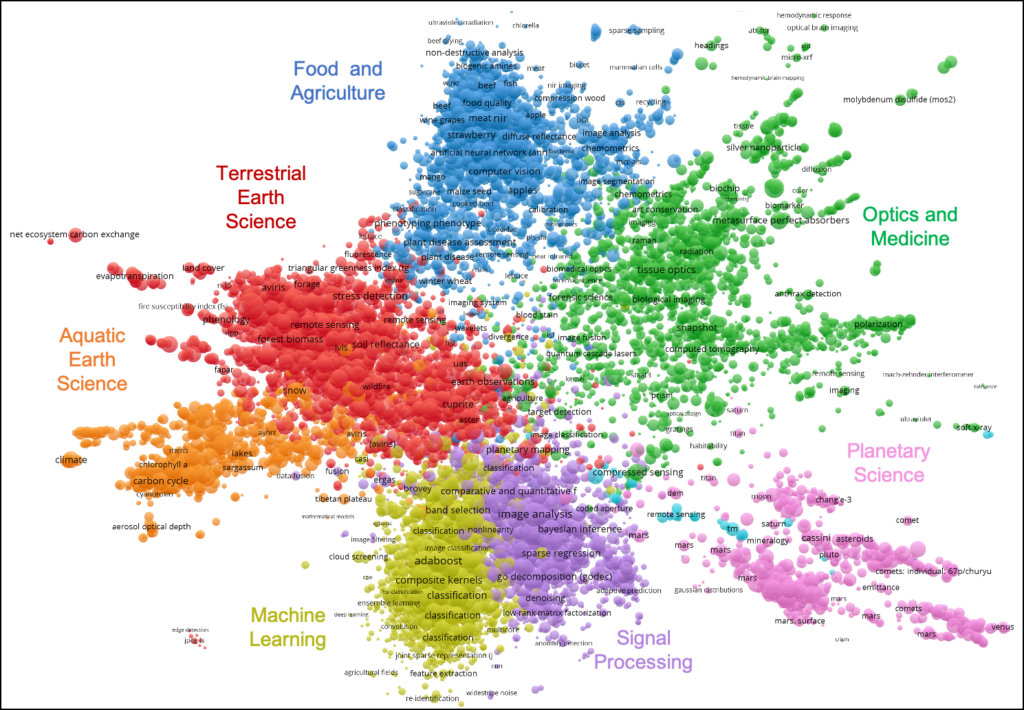
Fig. 1. Research communities tend to sort themselves into self-citing clusters. Circles in this figure represent scientific journal publications, with the size proportional to the number of citations. Map distance indicates similarity in the citation network. Seven of nine total clusters are shown; the other two (astrophysics and heliophysics) were predominantly isolated from the others. Annotations indicate keywords from representative publications. Image produced using VOSviewer.
The siloing is even stronger among published research in high-ranked scholarly journals, defined as having h-indices among the 20 highest in the 2020 public Google Scholar ranking. Fewer than 40% of the articles in our survey came from the clinical, Earth, and space science fields noted above, yet these fields produced all of the publications in top-ranked journals. We did not find a single instance in which one of those papers in a high-impact journal cited a paper from the methods cluster.
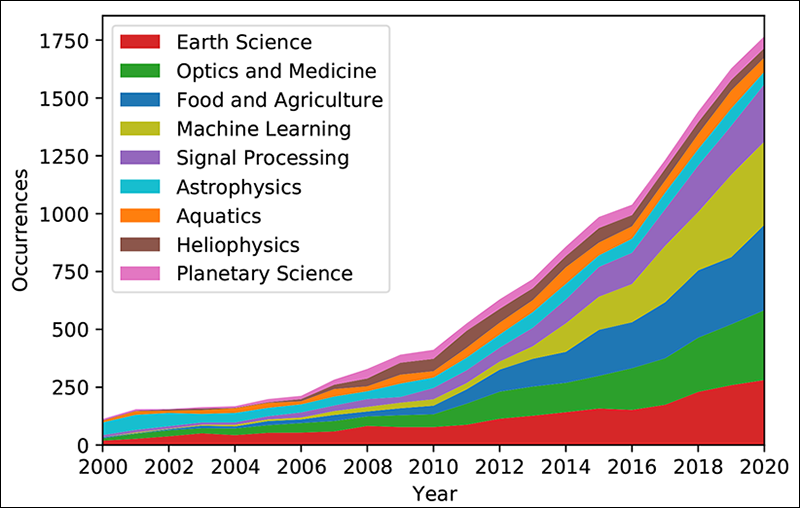
Fig. 2. The number of publications per year in each of the nine research communities considered is shown here.
A Dramatic Disconnect
From our analysis, we conclude that the recent boom in machine learning and signal processing research has not yet made a commensurate impact on the use of imaging spectroscopy in applied sciences.
A lack of citations does not necessarily imply a lack of influence. For instance, an Earth science paper that borrows techniques published in a machine learning paper may cite that manuscript once, whereas later studies applying the techniques may cite the science paper rather than the progenitor. Nonetheless, it is clear that despite constituting a large fraction of the research volume having to do with imaging spectroscopy for more than half a decade, research focused on machine learning and signal processing methods is nearly absent from high-impact science discoveries. This absence suggests a dramatic disconnect between science investigations and pure methodological research.
Research communities focused on improving the use of signal processing and machine learning with imaging spectroscopy have produced thousands of manuscripts through person-centuries of effort. How can we improve the science impact of these efforts?
Lowering Barriers to Entry
We have two main recommendations. The first is technical. The methodology-science disconnect is symptomatic of high barriers to entry for data science researchers to engage applied science questions.
Imaging spectroscopy data are still expensive to acquire, challenging to use, and regional in scale. Most top-ranked journal publications are written by career experts who plan and conduct specific acquisition campaigns and then perform each stage of the collection and analysis. This effort requires a chain of specialized steps involving instrument calibration, removal of atmospheric interference, and interpretation of reflectance spectra, all of which are challenging for nonexperts. These analyses often require expensive and complex software, raising obstacles for nonexpert researchers to engage cutting-edge geoscience problems.
In contrast, a large fraction of methodological research related to hyperspectral imaging focuses on packaged, publicly available benchmark scenes such as the Indian Pines [Baumgardner et al., 2015] or the University of Pavia [Università degli Studi di Pavia] (IT) [Dell’Acqua et al., 2004]. These benchmark scenes reduce multifaceted real-world measurement challenges to simplified classification tasks, creating well-defined problems with debatable relevance to pressing science questions.
Not all remote sensing disciplines have this disconnect. Hyperspectral imaging, involving hundreds of spectral channels, contrasts with multiband remote sensing, which generally involves only 3 to 10 channels and is far more commonly used. Multiband remote sensing instruments have regular global coverage, producing familiar image-like reflectance data. Although multiband instruments cannot measure the same wide range of phenomena as hyperspectral imagers, the maturity and extent of their data products democratize their use to address novel science questions.
We support efforts to similarly democratize imaging spectrometer data by improving and disseminating core data products, making pertinent science data more accessible to machine learning researchers. Open spectral libraries like SPECCHIO and EcoSIS exemplify this trend, as do the commitments by missions such as PRISMA, EnMAP, and EMIT to distribute reflectance data for each acquisition.
In the longer term, global imaging spectroscopy missions can increase data usage by providing data in a format that is user-friendly and ready to analyze. We also support open-source visualization and high-quality corrections for atmospheric effects to make existing hyperspectral data sets more accessible to nonexperts, thereby strengthening connections among methodological and application-based research communities. Recent efforts in this area include open source packages like the EnMAP-Box, HyTools, ISOFIT, and ImgSPEC.
Expanding the Envelope
Our second recommendation is cultural. Many of today’s most compelling science questions live at the limits of detectability—for example, in the first data acquisition over a new target, in a signal close to the noise, or in a relationship struggling for statistical significance. The papers in the planetary science cluster from our survey are exemplary in this respect, with many focusing on first observations of novel environments and achieving the best high-impact publication rate of any group. In contrast, a lot of methodological work makes use of standardized, well-understood benchmark data sets. Although benchmarks can help to coordinate research around key challenge areas, they should be connected to pertinent science questions.
Journal editors should encourage submission of manuscripts reporting research about specific, new, and compelling science problems of interest while also being more skeptical of incremental improvements in generic classification, regression, or unmixing algorithms. Science investigators in turn should partner with data scientists to pursue challenging (bio)geophysical investigations, thus broadening their technical tool kits and pushing the limits of what can be measured remotely.
Machine learning will play a central role in the next decade of imaging spectroscopy research, but its potential in the geosciences will be realized only through engagement with specific and pressing investigations. There is reason for optimism: The next generation of orbiting imaging spectrometer missions promises global coverage commensurate with existing imagers. We foresee a future in which, with judicious help from data science, imaging spectroscopy becomes as pervasive as multiband remote sensing is today.
Acknowledgments
The research was carried out at the Jet Propulsion Laboratory, California Institute of Technology (US), under a contract with National Aeronautics Space Agency (US) (80NM0018D0004). Copyright 2021. California Institute of Technology. Government sponsorship acknowledged.
References:
Asner, G. P., et al. (2017), Airborne laser-guided imaging spectroscopy to map forest trait diversity and guide conservation, Science, 355(6323), 385–389, https://doi.org/10.1126/science.aaj1987.
Baumgardner, M. F., L. L. Biehl, and D. A. Landgrebe (2015), 220 band AVIRIS hyperspectral image data set: June 12, 1992 Indian Pine Test Site 3, Purdue Univ. Res. Repository, https://doi.org/10.4231/R7RX991C.
Dell’Acqua, F., et al. (2004), Exploiting spectral and spatial information in hyperspectral urban data with high resolution, IEEE Geosci. Remote Sens. Lett., 1(4), 322–326, https://doi.org/10.1109/LGRS.2004.837009.
Duren, R. M., et al. (2019), California’s methane super-emitters, Nature, 575,
180–184, https://doi.org/10.1038/s41586-019-1720-3.
Harzing, A.-W., and S. Alakangas (2016), Google Scholar, Scopus and the Web of Science: A longitudinal and cross-disciplinary comparison, Scientometrics, 106, 787–804, https://doi.org/10.1007/s11192-015-1798-9.
Green, R. O., et al. (2020), The Earth Surface Mineral Dust Source Investigation: An Earth science imaging spectroscopy mission, in 2020 IEEE Aerospace Conference, pp. 1–15, IEEE, Piscataway, N.J., https://doi.org/10.1109/AERO47225.2020.9172731.
National Academies of Sciences, Engineering, and Medicine (2019), Thriving on Our Changing Planet: A Decadal Strategy for Earth Observation from Space, Natl. Acad. Press, Washington, D.C.
Pieters, C. M., et al. (2009), Character and spatial distribution of OH/H2O on the surface of the Moon seen by M3 on Chandrayaan-1, Science, 326(5952), 568–572, https://doi.org/10.1126/science.1178658.
Waltman, L., N. J. van Eck, and E. C. Noyons (2010), A unified approach to mapping and clustering of bibliometric networks, J. Informetrics, 4, 629–635, https://doi.org/10.1016/j.joi.2010.07.002.
See the full article here .

five-ways-keep-your-child-safe-school-shootings
Please help promote STEM in your local schools.
![]()
Eos is the leading source for trustworthy news and perspectives about the Earth and space sciences and their impact. Its namesake is Eos, the Greek goddess of the dawn, who represents the light shed on understanding our planet and its environment in space by the Earth and space sciences.
