January 17, 2019
Jason Patton, Ph.D.
The San Francisco Bay area is earthquake country. Historic and prehistoric evidence for earthquakes here informs us about the possibility of future shakers. On the Hayward Fault, we have an idea about their upper limit on size, but we don’t know when they will occur. The swarm in progress, with an M=3.4 quake on January 16 and today’s M=3.5 quake near Piedmont and Berkeley, are but one way to peer into an uncertain future. Ultimately, they remind us to be prepared to confront potential disaster.
Earthquake swarm highlights our earthquake history and our earthquake future
People in northern California have been in the midst of an earthquake swarm along the Hayward fault. Over 6,000 people reported observations of an M=3.4 quake and so far, over 4,000 have reported to the USGS “Did You Feel It?” website for the M=3.5 morning quake today.
One may think that these quakes are small, so why do they matter? Why should I care?
Prior to the 1906 San Francisco earthquake, the 1868 event was called the Great San Francisco Earthquake as the damage was widespread across the entire region. According to the USGS, the Hayward fault has the highest chance of rupture for all faults in the bay area, which is why Temblor’s Earthquake Scores for homes near the fault are among the highest anywhere in the U.S.
The USGS, California Geological Survey, and other stakeholders like the California Earthquake Authority (earthquake insurance) have teamed up to help people learn about a probable repeat of the 1868 earthquake. Learn more about the “HayWired Scenario” on this website.
Below is a map that shows how the shaking intensity may be across the region in a scenario M=7 quake, similar to the 1868 event. (Hudnut et al., 2018).

Shaking severity from an hypothetical earthquake on the Hayward fault.
Last year there was an M=4.4 earthquake in the Piedmont area, which is pretty close to the swarm of quakes that hit in the past 2 days, although unlike today’s quake, it was not on the main strand of the Hayward Fault. Along the Hayward fault, sometimes there is a series of earthquakes that all have similar magnitudes (a swarm) and sometimes there is an earthquake that is larger than the others (a sequence). According to Dr. Peggy Hellweg, Project Manager for the Berkeley Seismological Laboratory seismic network, “typically what we see on the Hayward fault are sequences” and that there is a sequence about every 2 to 5 years, over the past 20 years. Here is a blog post from the Berkeley Seismo Blog for a quake in 2017.
Sadly, the USGS cannot respond to press inquiries due to the U.S. Government shutdown. However, we can use the USGS earthquake catalog to learn about the recent history of earthquakes along the Hayward fault (see map below). Within 2 km (1.2 mi) of the fault trace, on average, there are quakes a little less than once a year. Quakes right in the Hayward Fault trace are rarer, they strike about once every 3 years. One sees no obvious migration of these quakes with time, which makes it impossible to identify if the fault is getting ready for a “Big One.”

Hayward fault earthquake locations since 1985.
For now, we don’t’ know if this swarm will lead to larger magnitude earthquakes. However, we do know that as time passes, the fault gradually stores more elastic energy and this leads to an increased chance of an earthquake.
There is lots much we can learn about what happened in past earthquakes so we can prepare for future earthquakes. We recently reviewed what we learned over the past 25 since the 1994 M=6.7 Northridge earthquake here. Note the similar earthquake magnitude for the Hayward and Northridge earthquakes.
The Hayward Fault is HayWired
The Hayward Fault is unusual. Part of the Hayward fault is creeping aseismically (moving side by side without earthquakes) and part of the fault is locked (clamped together, storing energy that may be released during an earthquake). As the fault creeps, this places additional stress on the adjacent portions of the fault that are locked. The same is true for small earthquakes like the ongoing swarm, they add stress to the fault. A 100-km-long (60 mi) portion of the San Andreas also creeps, but the rest is locked. What makes the Hayward unique is that it exhibits both behaviors everywhere.
Scientists have been studying how the fault stores this energy over time (e.g. Shirzaei et al., 2013), using satellite data and physical measurements of plate motion in the region. Shirzaei et al. (2013) found that both creep and these small earthquakes add to the stress on the fault and bring us closer to an earthquake.
“We estimate that a slip-rate deficit equivalent to Mw 6.3–6.8 has accumulated on the fault, since the last event in 1868.” (Shirzaei and R. Bürgmann, 2013).
Below is an updated plot provided by Dr. Roland Bürgmann, Professor of Earth and Planetary Science at U.C. Berkeley. This figure shows the fault surface at depth and the color represents how much of the fault is creeping (red = more creep). Drs. Bürgmann and Shirzaei have plotted the earthquake locations from the past decade or so, including from the current swarm.

Dr. Bürgmann wrote us this morning, “I’d like to point out that it was last year’s M=4.4 quake that made me sign up for earthquake insurance.”
Ground Shaking, Building Collapse, Landslides, Liquefaction
This is a short laundry list of potential damage that will probably face northern California residents during and following a future Hayward fault earthquake.
Conclusions from the USGS HayWired Earthquake Scenario are sobering, however we can take action now to be more resilient in the face of this natural disaster.
The mainshock will be damaging, but so will be the aftershocks. Building damage may exceed $82 billion (in 2016 dollars). As many as 152,000 households may be displaced, placing as many as 411,000 people on the streets (2000 census data). There may be 800 deaths and over 18,000 injuries. As many as 2,500 people may be trapped in buildings and more than 22,000 people could be stuck in elevators.
As we mentioned in a report on the Sacramento-San Joaquin River Delta about potential levee failures, there may also be substantial damage to the water supply infrastructure as well. It may take as long as 30 to 210 days to restore water supplies for some of the counties in the bay area. Fires can be expected following a HayWired Scenario event. There may be over 400 fires, causing hundreds of additional deaths and contributing to an additional $30 billion in damages.
There is a suite of natural hazards information available on the temblor app to help one learn the extent to which people are exposed to these hazards. Below is a map that shows the potential for liquefaction in the region. Learn more about landslides and liquefaction in our report from earlier this year here.

Liquefaction susceptibility from earthquakes in the SF Bay Area. The red dot is the M=3.5 earthquake felt this morning.
Do you know where your home or workplace fits in earthquake country? Are you prepared? Check Your Risk in the Temblor app here.
See the full article here .

five-ways-keep-your-child-safe-school-shootings
Please help promote STEM in your local schools.
![]()
Stem Education Coalition
![]()
![]()
Earthquake Network project
Earthquake Network is a research project which aims at developing and maintaining a crowdsourced smartphone-based earthquake warning system at a global level. Smartphones made available by the population are used to detect the earthquake waves using the on-board accelerometers. When an earthquake is detected, an earthquake warning is issued in order to alert the population not yet reached by the damaging waves of the earthquake.
The project started on January 1, 2013 with the release of the homonymous Android application Earthquake Network. The author of the research project and developer of the smartphone application is Francesco Finazzi of the University of Bergamo, Italy.
Get the app in the Google Play store.
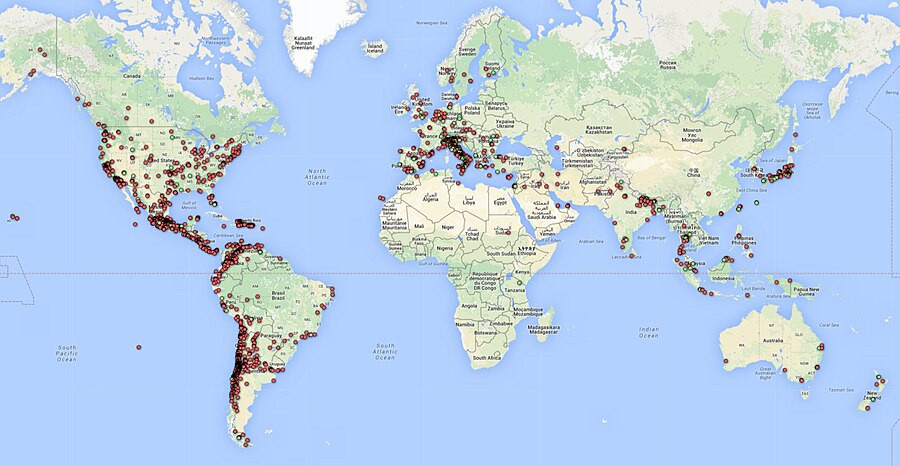
Smartphone network spatial distribution (green and red dots) on December 4, 2015
Meet The Quake-Catcher Network

The Quake-Catcher Network is a collaborative initiative for developing the world’s largest, low-cost strong-motion seismic network by utilizing sensors in and attached to internet-connected computers. With your help, the Quake-Catcher Network can provide better understanding of earthquakes, give early warning to schools, emergency response systems, and others. The Quake-Catcher Network also provides educational software designed to help teach about earthquakes and earthquake hazards.
After almost eight years at Stanford, and a year at CalTech, the QCN project is moving to the University of Southern California Dept. of Earth Sciences. QCN will be sponsored by the Incorporated Research Institutions for Seismology (IRIS) and the Southern California Earthquake Center (SCEC).
The Quake-Catcher Network is a distributed computing network that links volunteer hosted computers into a real-time motion sensing network. QCN is one of many scientific computing projects that runs on the world-renowned distributed computing platform Berkeley Open Infrastructure for Network Computing (BOINC).
The volunteer computers monitor vibrational sensors called MEMS accelerometers, and digitally transmit “triggers” to QCN’s servers whenever strong new motions are observed. QCN’s servers sift through these signals, and determine which ones represent earthquakes, and which ones represent cultural noise (like doors slamming, or trucks driving by).
There are two categories of sensors used by QCN: 1) internal mobile device sensors, and 2) external USB sensors.
Mobile Devices: MEMS sensors are often included in laptops, games, cell phones, and other electronic devices for hardware protection, navigation, and game control. When these devices are still and connected to QCN, QCN software monitors the internal accelerometer for strong new shaking. Unfortunately, these devices are rarely secured to the floor, so they may bounce around when a large earthquake occurs. While this is less than ideal for characterizing the regional ground shaking, many such sensors can still provide useful information about earthquake locations and magnitudes.
USB Sensors: MEMS sensors can be mounted to the floor and connected to a desktop computer via a USB cable. These sensors have several advantages over mobile device sensors. 1) By mounting them to the floor, they measure more reliable shaking than mobile devices. 2) These sensors typically have lower noise and better resolution of 3D motion. 3) Desktops are often left on and do not move. 4) The USB sensor is physically removed from the game, phone, or laptop, so human interaction with the device doesn’t reduce the sensors’ performance. 5) USB sensors can be aligned to North, so we know what direction the horizontal “X” and “Y” axes correspond to.
If you are a science teacher at a K-12 school, please apply for a free USB sensor and accompanying QCN software. QCN has been able to purchase sensors to donate to schools in need. If you are interested in donating to the program or requesting a sensor, click here.
BOINC is a leader in the field(s) of Distributed Computing, Grid Computing and Citizen Cyberscience.BOINC is more properly the Berkeley Open Infrastructure for Network Computing, developed at UC Berkeley.
Earthquake safety is a responsibility shared by billions worldwide. The Quake-Catcher Network (QCN) provides software so that individuals can join together to improve earthquake monitoring, earthquake awareness, and the science of earthquakes. The Quake-Catcher Network (QCN) links existing networked laptops and desktops in hopes to form the worlds largest strong-motion seismic network.
Below, the QCN Quake Catcher Network map

ShakeAlert: An Earthquake Early Warning System for the West Coast of the United States

The U. S. Geological Survey (USGS) along with a coalition of State and university partners is developing and testing an earthquake early warning (EEW) system called ShakeAlert for the west coast of the United States. Long term funding must be secured before the system can begin sending general public notifications, however, some limited pilot projects are active and more are being developed. The USGS has set the goal of beginning limited public notifications in 2018.
Watch a video describing how ShakeAlert works in English or Spanish.
The primary project partners include:
United States Geological Survey
California Governor’s Office of Emergency Services (CalOES)
California Geological Survey
California Institute of Technology
University of California Berkeley
University of Washington
University of Oregon
Gordon and Betty Moore Foundation
The Earthquake Threat
Earthquakes pose a national challenge because more than 143 million Americans live in areas of significant seismic risk across 39 states. Most of our Nation’s earthquake risk is concentrated on the West Coast of the United States. The Federal Emergency Management Agency (FEMA) has estimated the average annualized loss from earthquakes, nationwide, to be $5.3 billion, with 77 percent of that figure ($4.1 billion) coming from California, Washington, and Oregon, and 66 percent ($3.5 billion) from California alone. In the next 30 years, California has a 99.7 percent chance of a magnitude 6.7 or larger earthquake and the Pacific Northwest has a 10 percent chance of a magnitude 8 to 9 megathrust earthquake on the Cascadia subduction zone.
Part of the Solution
Today, the technology exists to detect earthquakes, so quickly, that an alert can reach some areas before strong shaking arrives. The purpose of the ShakeAlert system is to identify and characterize an earthquake a few seconds after it begins, calculate the likely intensity of ground shaking that will result, and deliver warnings to people and infrastructure in harm’s way. This can be done by detecting the first energy to radiate from an earthquake, the P-wave energy, which rarely causes damage. Using P-wave information, we first estimate the location and the magnitude of the earthquake. Then, the anticipated ground shaking across the region to be affected is estimated and a warning is provided to local populations. The method can provide warning before the S-wave arrives, bringing the strong shaking that usually causes most of the damage.
Studies of earthquake early warning methods in California have shown that the warning time would range from a few seconds to a few tens of seconds. ShakeAlert can give enough time to slow trains and taxiing planes, to prevent cars from entering bridges and tunnels, to move away from dangerous machines or chemicals in work environments and to take cover under a desk, or to automatically shut down and isolate industrial systems. Taking such actions before shaking starts can reduce damage and casualties during an earthquake. It can also prevent cascading failures in the aftermath of an event. For example, isolating utilities before shaking starts can reduce the number of fire initiations.
System Goal
The USGS will issue public warnings of potentially damaging earthquakes and provide warning parameter data to government agencies and private users on a region-by-region basis, as soon as the ShakeAlert system, its products, and its parametric data meet minimum quality and reliability standards in those geographic regions. The USGS has set the goal of beginning limited public notifications in 2018. Product availability will expand geographically via ANSS regional seismic networks, such that ShakeAlert products and warnings become available for all regions with dense seismic instrumentation.
Current Status
The West Coast ShakeAlert system is being developed by expanding and upgrading the infrastructure of regional seismic networks that are part of the Advanced National Seismic System (ANSS); the California Integrated Seismic Network (CISN) is made up of the Southern California Seismic Network, SCSN) and the Northern California Seismic System, NCSS and the Pacific Northwest Seismic Network (PNSN). This enables the USGS and ANSS to leverage their substantial investment in sensor networks, data telemetry systems, data processing centers, and software for earthquake monitoring activities residing in these network centers. The ShakeAlert system has been sending live alerts to “beta” users in California since January of 2012 and in the Pacific Northwest since February of 2015.
In February of 2016 the USGS, along with its partners, rolled-out the next-generation ShakeAlert early warning test system in California joined by Oregon and Washington in April 2017. This West Coast-wide “production prototype” has been designed for redundant, reliable operations. The system includes geographically distributed servers, and allows for automatic fail-over if connection is lost.
This next-generation system will not yet support public warnings but does allow selected early adopters to develop and deploy pilot implementations that take protective actions triggered by the ShakeAlert notifications in areas with sufficient sensor coverage.
Authorities
The USGS will develop and operate the ShakeAlert system, and issue public notifications under collaborative authorities with FEMA, as part of the National Earthquake Hazard Reduction Program, as enacted by the Earthquake Hazards Reduction Act of 1977, 42 U.S.C. §§ 7704 SEC. 2.
For More Information
Robert de Groot, ShakeAlert National Coordinator for Communication, Education, and Outreach
rdegroot@usgs.gov
626-583-7225
